
100 Real Estate Contract & Closing Statistics, November 2026
Updated November 2026.
Getting an offer accepted and getting a transaction closed are different jobs. This reference focuses on the work between them: financing, contingencies, documents, title coordination, signatures and verification.
The findings combine national professional surveys, federal mortgage data and reported fraud information, with a separately labeled Colorado view. Each observation retains its period and source. These are industry findings, not OfferSetGo customer results or estimates of the time its software saves.
Key Takeaways
- Delayed settlement, September survey: 16%. September 2026 survey; contracts in past three months. (NAR, October 2026).
- Terminated contracts, September survey: 7%. September 2026 survey; contracts in past three months. (NAR, October 2026).
- Median time to close: 30 days. September 2026. (NAR, October 2026).
- Conventional Conforming published denial rate: 16.33%. 2026 Q2. (CFPB / FFIEC, July 2026).
- FHA published denial rate: 26.60%. 2026 Q2. (CFPB / FFIEC, July 2026).
- Respondents: purchase file, over 50 documents: 21%. 2025 survey; reported average workload. (ALTA / ndp analytics, March 2026).
- Pain point: prior mortgage releases: 59.0%. 2025 survey; significant pain-point selections overlap. (ALTA / ndp analytics, March 2026).
- Adoption goal: saving time: 81%. 2026 survey; agents’ responses. (NAR, September 2026).
- Tool used: electronic signatures: 79%. 2026 survey; agents’ responses. (NAR, September 2026).
- At least one attempt during prior calendar year: 59%. 2026 survey; prior calendar year: 2025. (ALTA / Elevated Insights Group, September 2026).
- Firms using multiple helpful detection tools: 94%. 2026 survey; red-flag categories overlap. (ALTA / Elevated Insights Group, September 2026).
- Colorado Real Estate victim count: 273. 2025, Colorado. (FBI IC3, April 2026).
How often do real estate contracts face delays or cancellation?
An accepted offer starts a coordination process. Track closing time, delay and termination separately so that an apparent change in one does not conceal another.
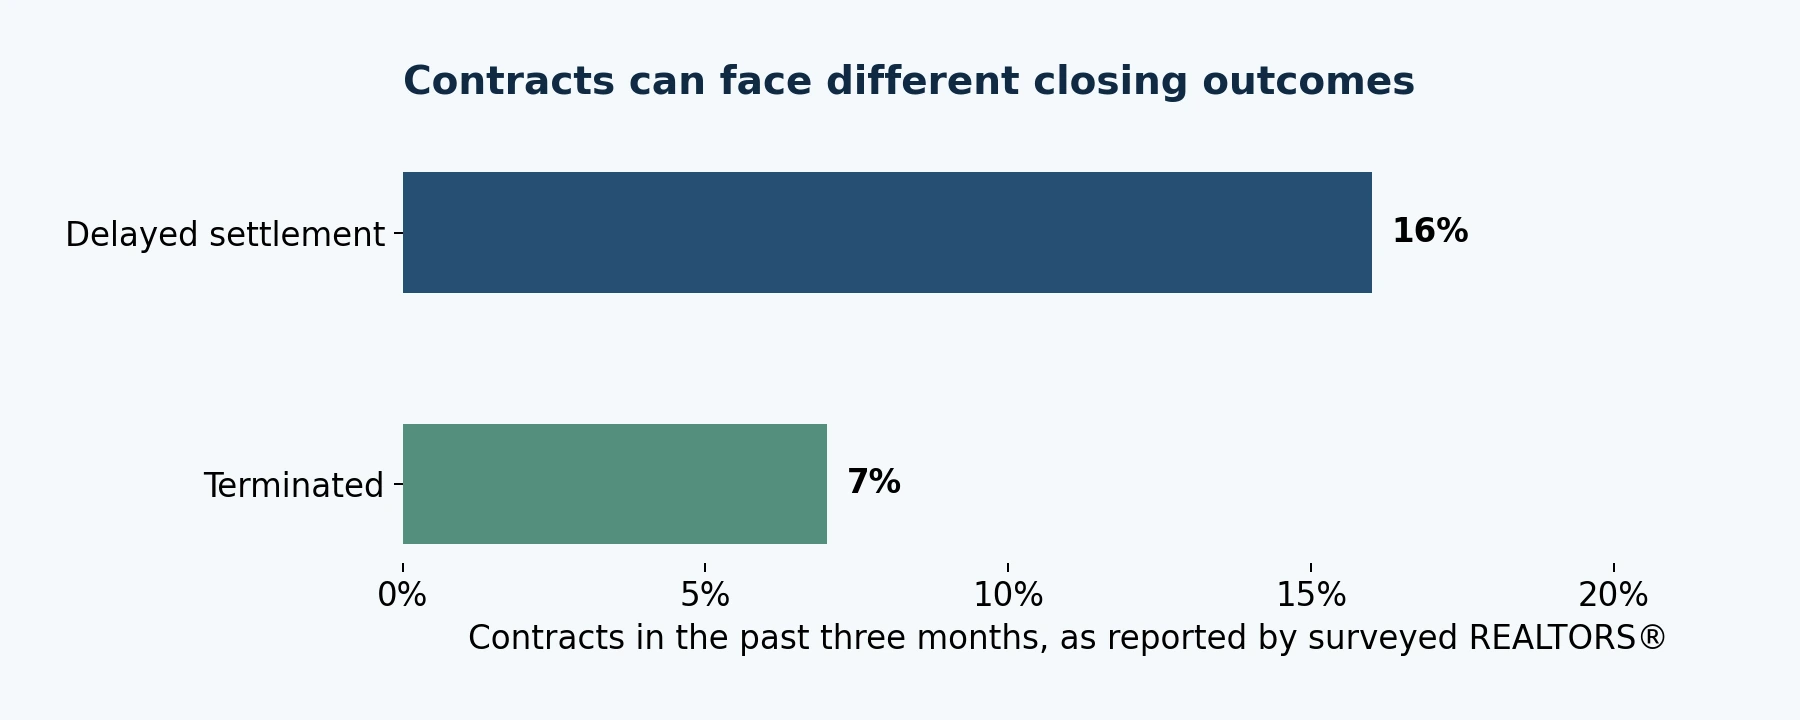
How do delayed and terminated contracts compare?
A delayed settlement can still close; a termination ends that contract. NAR measures both over a rolling period. The rows below preserve the earlier survey periods rather than treating them as one transaction ledger. For workflow planning, preserve the status history and the recorded reason for a change, alongside the current closing date.
| Measure | Period / scope | Reported result and source |
|---|---|---|
| Delayed settlement, August survey | August 2026 comparison; contracts in past three months | 14% (NAR, October 2026) |
| Terminated contracts, August survey | August 2026 comparison; contracts in past three months | 7% (NAR, October 2026) |
| Delayed settlement, prior September survey | September 2025 comparison; contracts in past three months | 14% (NAR, October 2026) |
| Terminated contracts, prior September survey | September 2025 comparison; contracts in past three months | 6% (NAR, October 2026) |
How long does a contract typically take to close?
NAR reports a median contract-to-close interval, separately from time on market. That describes the middle reported transaction rather than a deadline for every deal. The earlier comparison rows retain their own periods even where the values match. An individual agreement still needs its actual dates, responsible parties and amendment history.
| Measure | Period / scope | Reported result and source |
|---|---|---|
| Median time to close | August 2026 | 30 days (NAR, October 2026) |
| Median time to close | September 2025 | 30 days (NAR, October 2026) |
How do offers and contingencies shape the work after acceptance?
The survey records contingency waivers and the average offers received on the most recent sale. Inspection and appraisal concern different protections; offers received is a count rather than a percentage. The period labels preserve those comparisons. A useful workflow inference is to retain the accepted version and identify changed terms, so negotiation history remains connected to the deal.
| Measure | Period / scope | Reported result and source |
|---|---|---|
| Buyers waiving inspection contingency | September 2026 | 20% (NAR, October 2026) |
| Buyers waiving appraisal contingency | September 2026 | 18% (NAR, October 2026) |
| Average offers on most recent sale | September 2026 | 2.2 (NAR, October 2026) |
| Buyers waiving inspection contingency | August 2026 | 20% (NAR, October 2026) |
| Buyers waiving appraisal contingency | August 2026 | 22% (NAR, October 2026) |
| Average offers on most recent sale | August 2026 | 2.1 (NAR, October 2026) |
| Buyers waiving inspection contingency | September 2025 | 21% (NAR, October 2026) |
| Buyers waiving appraisal contingency | September 2025 | 19% (NAR, October 2026) |
| Average offers on most recent sale | September 2025 | 2.3 (NAR, October 2026) |
For the Colorado-specific workflow, see OfferSetGo’s contract deadlines guide.
What do mortgage denial rates show about financing readiness?
A financing plan deserves its own evidence trail. Published mortgage aggregates can provide context, but they cannot determine whether a buyer under contract will obtain a particular loan.
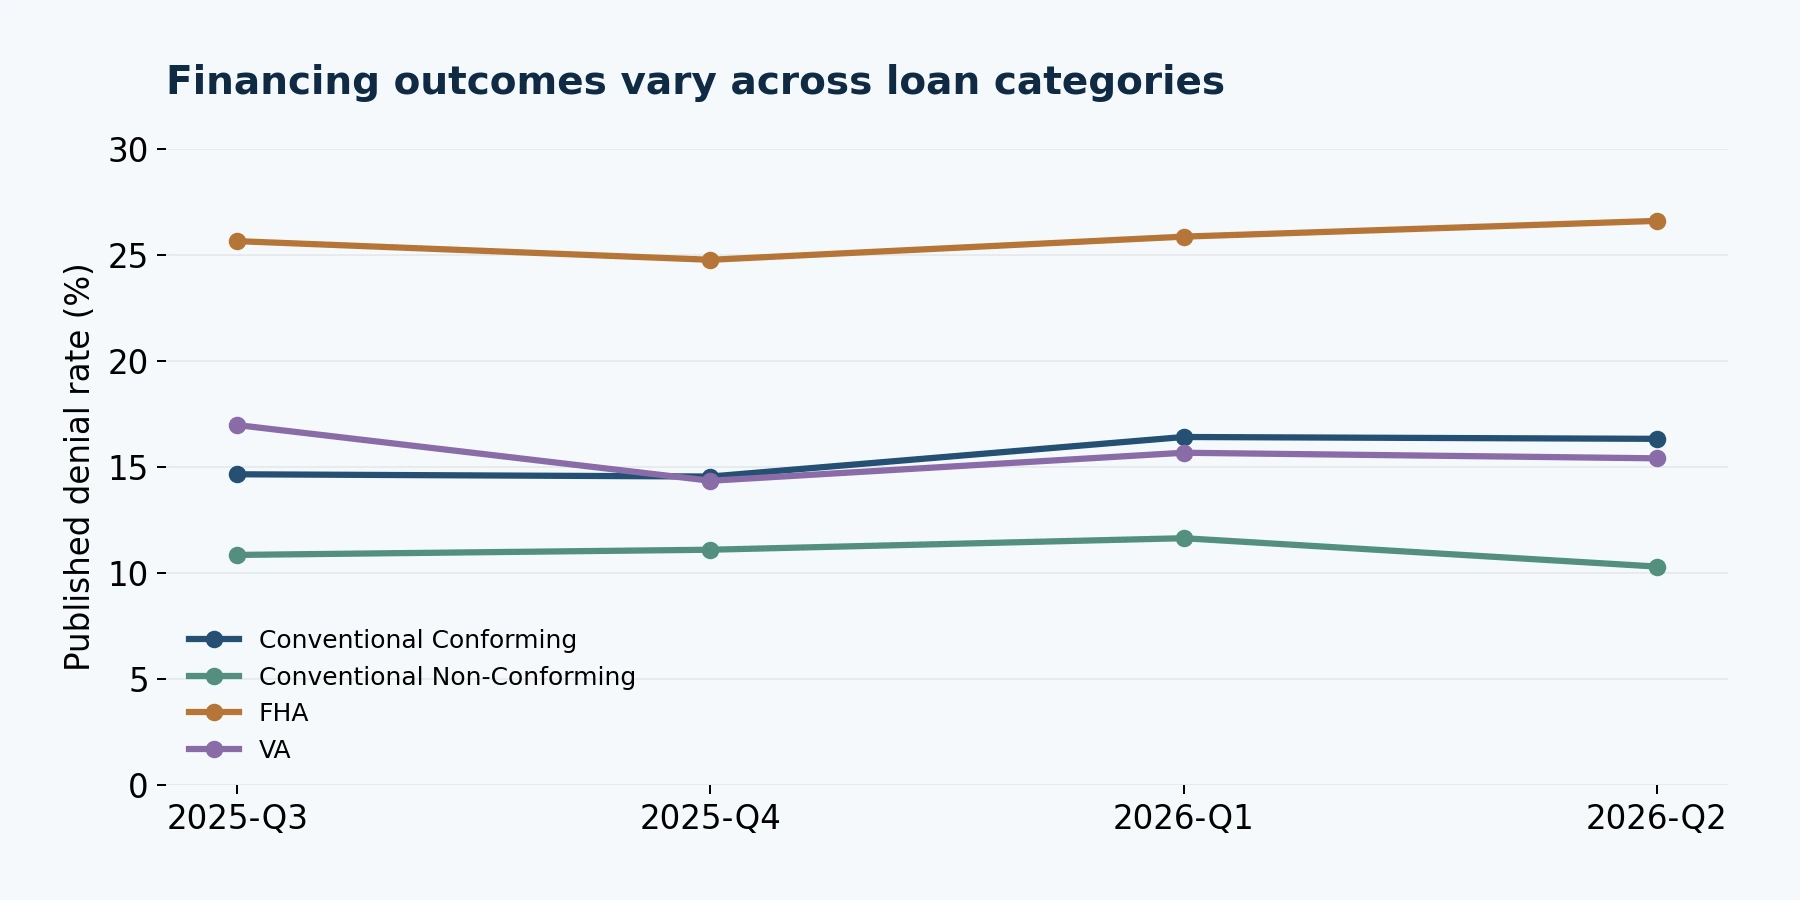
How do conventional loan categories compare?
The federal graph reports conforming and non-conforming conventional loans separately. Its history covers institutions designated as current quarterly filers, whose earlier data can be restated when that cohort changes. These published denial rates use the producer’s filters and rounding. They describe financing outcomes across that cohort, rather than the prospects of a particular buyer or Colorado purchase contract.
| Measure | Period / scope | Reported result and source |
|---|---|---|
| Conventional Conforming published denial rate | 2025 Q3 | 14.65% (CFPB / FFIEC, July 2026) |
| Conventional Conforming published denial rate | 2025 Q4 | 14.55% (CFPB / FFIEC, July 2026) |
| Conventional Conforming published denial rate | 2026 Q1 | 16.41% (CFPB / FFIEC, July 2026) |
| Conventional Non-Conforming published denial rate | 2025 Q3 | 10.85% (CFPB / FFIEC, July 2026) |
| Conventional Non-Conforming published denial rate | 2025 Q4 | 11.10% (CFPB / FFIEC, July 2026) |
| Conventional Non-Conforming published denial rate | 2026 Q1 | 11.64% (CFPB / FFIEC, July 2026) |
| Conventional Non-Conforming published denial rate | 2026 Q2 | 10.30% (CFPB / FFIEC, July 2026) |
What does the FHA series report?
FHA is a separate loan-type series in the same federal graph. Its current-quarter observation is in the takeaways; earlier quarters appear below. Applicant mix and reporting filters matter when comparing categories. The operational inference is to keep the lender’s actual status and outstanding conditions attached to the deal, alongside the agreement’s financing terms.
| Measure | Period / scope | Reported result and source |
|---|---|---|
| FHA published denial rate | 2025 Q3 | 25.65% (CFPB / FFIEC, July 2026) |
| FHA published denial rate | 2025 Q4 | 24.77% (CFPB / FFIEC, July 2026) |
| FHA published denial rate | 2026 Q1 | 25.86% (CFPB / FFIEC, July 2026) |
What does the VA series report?
The VA line supplies another dated view of financing outcomes. The public graph does not establish that this is a purchase-only series. An application outcome also differs from a real estate contract outcome. Keeping application progress, outstanding documents and contractual dates distinguishable makes a transaction’s financing status more informative than a single completed-or-not label.
| Measure | Period / scope | Reported result and source |
|---|---|---|
| VA published denial rate | 2025 Q3 | 16.98% (CFPB / FFIEC, July 2026) |
| VA published denial rate | 2025 Q4 | 14.35% (CFPB / FFIEC, July 2026) |
| VA published denial rate | 2026 Q1 | 15.67% (CFPB / FFIEC, July 2026) |
| VA published denial rate | 2026 Q2 | 15.41% (CFPB / FFIEC, July 2026) |
Why does title clearance require document coordination?
Title work is a coordination problem as well as a search problem. The handoffs between records, parties and releases deserve visibility before the closing date arrives.
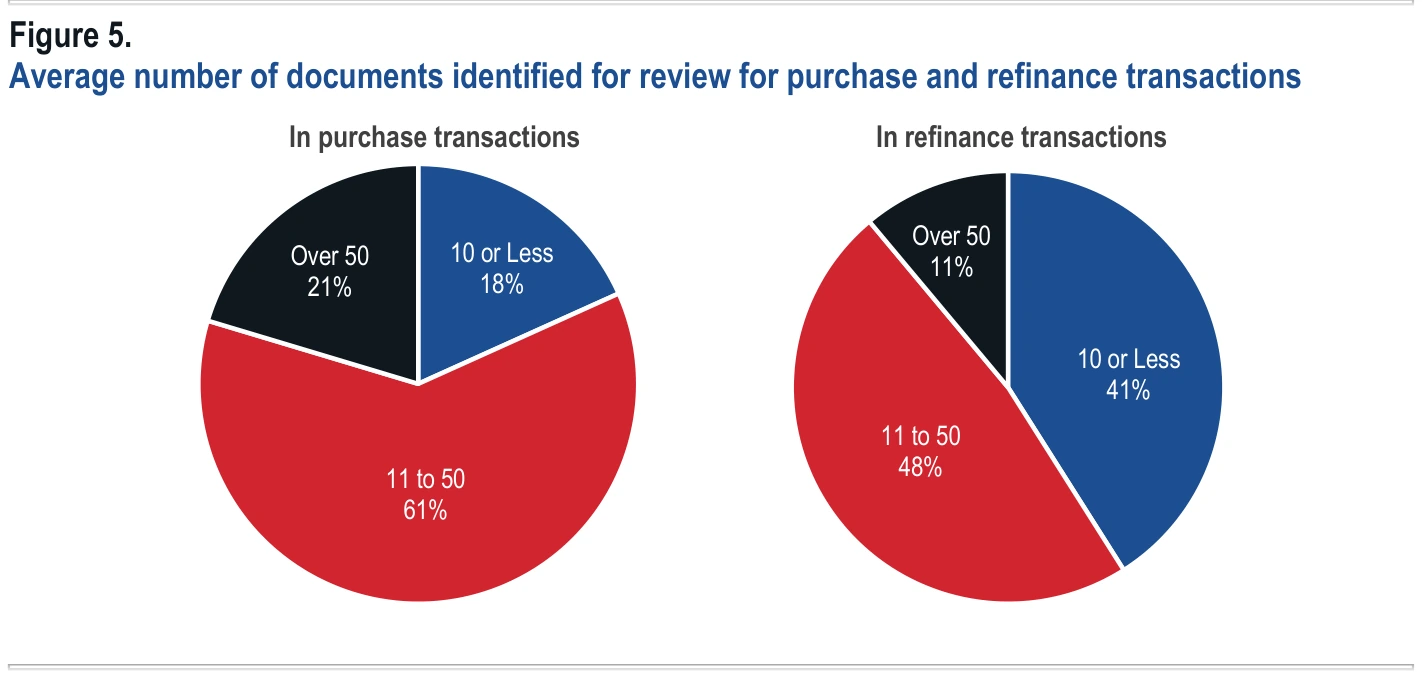
How much documentation do title professionals review?
The ALTA chart records respondents’ average document workload for purchase and refinance files. The bins describe survey responses, rather than a census of individual closings. The purchase category highlighted in the takeaways is omitted below. For coordination, identify the outstanding document and its owner; folder size alone does not establish that a title review is complete.
| Measure | Period / scope | Reported result and source |
|---|---|---|
| Respondents: purchase file, 10 or fewer documents | 2025 survey; reported average workload | 18% (ALTA / ndp analytics, March 2026) |
| Respondents: purchase file, 11–50 documents | 2025 survey; reported average workload | 61% (ALTA / ndp analytics, March 2026) |
| Respondents: refinance file, 10 or fewer documents | 2025 survey; reported average workload | 41% (ALTA / ndp analytics, March 2026) |
| Respondents: refinance file, 11–50 documents | 2025 survey; reported average workload | 48% (ALTA / ndp analytics, March 2026) |
| Respondents: refinance file, over 50 documents | 2025 survey; reported average workload | 11% (ALTA / ndp analytics, March 2026) |
Where do title searches obtain their information?
Title professionals report consulting multiple record sources, with overlapping selections. Public-office records and different searches can contribute to the same file. These rows illustrate the importance of retaining a record’s source, the version reviewed and the person awaiting it. Source access is one part of the title professional’s broader examination.
| Measure | Period / scope | Reported result and source |
|---|---|---|
| Source used: taxing authorities | 2025 survey; source selections overlap | 94.0% (ALTA / ndp analytics, March 2026) |
| Source used: recorder’s office | 2025 survey; source selections overlap | 91.9% (ALTA / ndp analytics, March 2026) |
| Source used: name searches | 2025 survey; source selections overlap | 88.1% (ALTA / ndp analytics, March 2026) |
| Source used: courthouse | 2025 survey; source selections overlap | 83.3% (ALTA / ndp analytics, March 2026) |
| Source used: assessment searches | 2025 survey; source selections overlap | 77.6% (ALTA / ndp analytics, March 2026) |
| Source used: Patriot searches | 2025 survey; source selections overlap | 74.9% (ALTA / ndp analytics, March 2026) |
Which curative tasks create coordination difficulties?
These shares identify significant pain points reported by title professionals. Answers overlap: they do not describe the percentage of homes with each defect. For workflow design, a useful inference is to give an unresolved item an owner, a status and a place for supporting correspondence. Resolution remains a separate professional task from tracking the item.
| Measure | Period / scope | Reported result and source |
|---|---|---|
| Pain point: work beyond underwriting approval | 2025 survey; significant pain-point selections overlap | 44.1% (ALTA / ndp analytics, March 2026) |
| Pain point: coordinating payoffs | 2025 survey; significant pain-point selections overlap | 35.9% (ALTA / ndp analytics, March 2026) |
| Pain point: accurate information from parties | 2025 survey; significant pain-point selections overlap | 31.9% (ALTA / ndp analytics, March 2026) |
| Pain point: paid-in-full letters / lien releases | 2025 survey; significant pain-point selections overlap | 29.2% (ALTA / ndp analytics, March 2026) |
| Pain point: finding HOA contacts | 2025 survey; significant pain-point selections overlap | 28.9% (ALTA / ndp analytics, March 2026) |
| Pain point: probate documents | 2025 survey; significant pain-point selections overlap | 27.4% (ALTA / ndp analytics, March 2026) |
| Pain point: gathering standard file information | 2025 survey; significant pain-point selections overlap | 13.1% (ALTA / ndp analytics, March 2026) |
How are agents digitizing contracts and transaction workflows?
Adoption and effectiveness are different questions. Use the technology research to understand agents’ priorities, then evaluate a specific workflow on what it actually does.
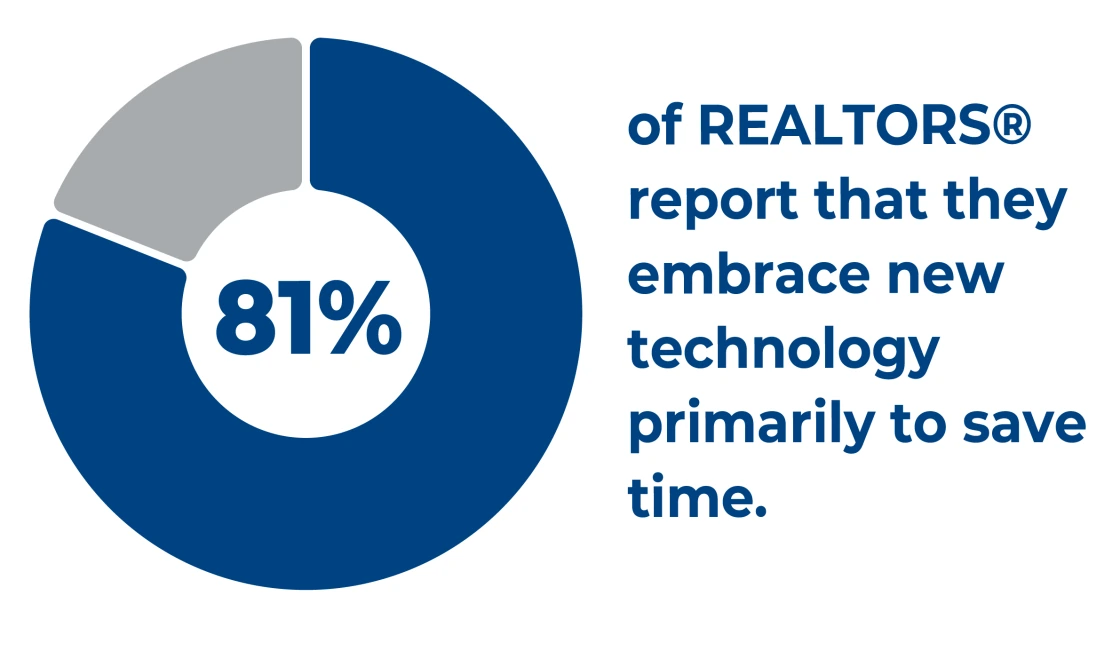
What do agents want technology to improve?
NAR distinguishes agents’ reasons for adopting technology from their reports of client reactions. Several motivations can apply at once. A stated goal of less manual work differs from a measured reduction in contract-preparation time. A practical software evaluation can follow a draft through review and revision, checking which information stays connected and which decisions require judgment.
| Measure | Period / scope | Reported result and source |
|---|---|---|
| Adoption goal: client experience | 2026 survey; agents’ responses | 71% (NAR, September 2026) |
| Adoption goal: closing more deals | 2026 survey; agents’ responses | 57% (NAR, September 2026) |
| Adoption goal: less manual work | 2026 survey; agents’ responses | 54% (NAR, September 2026) |
| Adoption goal: staying competitive | 2026 survey; agents’ responses | 44% (NAR, September 2026) |
| Clients responded very positively, agents report | 2026 survey; agents’ responses | 40% (NAR, September 2026) |
| Clients found technology helpful with reservations, agents report | 2026 survey; agents’ responses | 37% (NAR, September 2026) |
Which workflow tools and adoption barriers do agents report?
Electronic signatures appear in the takeaways; these selected rows cover other tools and adoption barriers. Scheduling and contact management serve different tasks, while training and cost affect implementation. Evaluate each part of the workflow separately: preparing a document, collecting signatures, delivering it and keeping its history connected to the transaction.
| Measure | Period / scope | Reported result and source |
|---|---|---|
| Tool used: scheduling showings | 2026 survey; agents’ responses | 68% (NAR, September 2026) |
| Tool used: CRM | 2026 survey; agents’ responses | 46% (NAR, September 2026) |
| Adoption challenge: learning curve | 2026 survey; agents’ responses | 63% (NAR, September 2026) |
| Adoption challenge: cost | 2026 survey; agents’ responses | 59% (NAR, September 2026) |
Where does AI fit into document and communication tasks?
The AI-task rows describe agents who use AI. Frequency rows describe surveyed agents more broadly, and the selected categories do not constitute a complete distribution. Drafting correspondence and summarizing a document are also different tasks. These findings describe reported use; reviewing the actual form and accepted terms remains its own step.
| Measure | Period / scope | Reported result and source |
|---|---|---|
| AI users: email / follow-up drafting | 2026 survey; among agents using AI | 52% (NAR, September 2026) |
| AI users: document review / summarizing | 2026 survey; among agents using AI | 27% (NAR, September 2026) |
| AI frequency: daily | 2026 survey; surveyed agents; selected categories | 23% (NAR, September 2026) |
| AI frequency: weekly | 2026 survey; surveyed agents; selected categories | 25% (NAR, September 2026) |
| AI frequency: occasional experimentation | 2026 survey; surveyed agents; selected categories | 31% (NAR, September 2026) |
| Not using AI, with no plans to use it | 2026 survey; surveyed agents; selected categories | 12% (NAR, September 2026) |
Explore OfferSetGo’s supported forms and mapping-readiness labels and the agent answer center when evaluating a contract workspace. Availability varies by form and feature.
What does seller impersonation research reveal about verification?
Verification needs more than an impression that a transaction looks ordinary. The survey distinguishes attempted fraud, commonly encountered characteristics and firms’ detection practices.
How widespread are reported impersonation attempts?
ALTA compares separate survey samples across years. Prior-calendar-year exposure and prior-month attempts are different questions, each about firms’ experience rather than the share of property sales involving fraud. The current annual-exposure figure is in the takeaways. Earlier exposure and the recent attempt distribution appear below, with their survey periods preserved.
| Measure | Period / scope | Reported result and source |
|---|---|---|
| At least one attempt during prior calendar year | 2024 survey; prior calendar year: 2023 | 28% (ALTA / Elevated Insights Group, September 2026) |
| Prior month: at least one attempt | 2026 survey; April 2026 | 45% (ALTA / Elevated Insights Group, September 2026) |
| Prior month: exactly one attempt | 2026 survey; April 2026 | 13% (ALTA / Elevated Insights Group, September 2026) |
| Prior month: exactly two attempts | 2026 survey; April 2026 | 8% (ALTA / Elevated Insights Group, September 2026) |
| Prior month: three or more attempts | 2026 survey; April 2026 | 23% (ALTA / Elevated Insights Group, September 2026) |
| Prior month: at least one attempt | 2024 survey; corresponding prior-month question | 19% (ALTA / Elevated Insights Group, September 2026) |
Which property and ownership characteristics are commonly encountered?
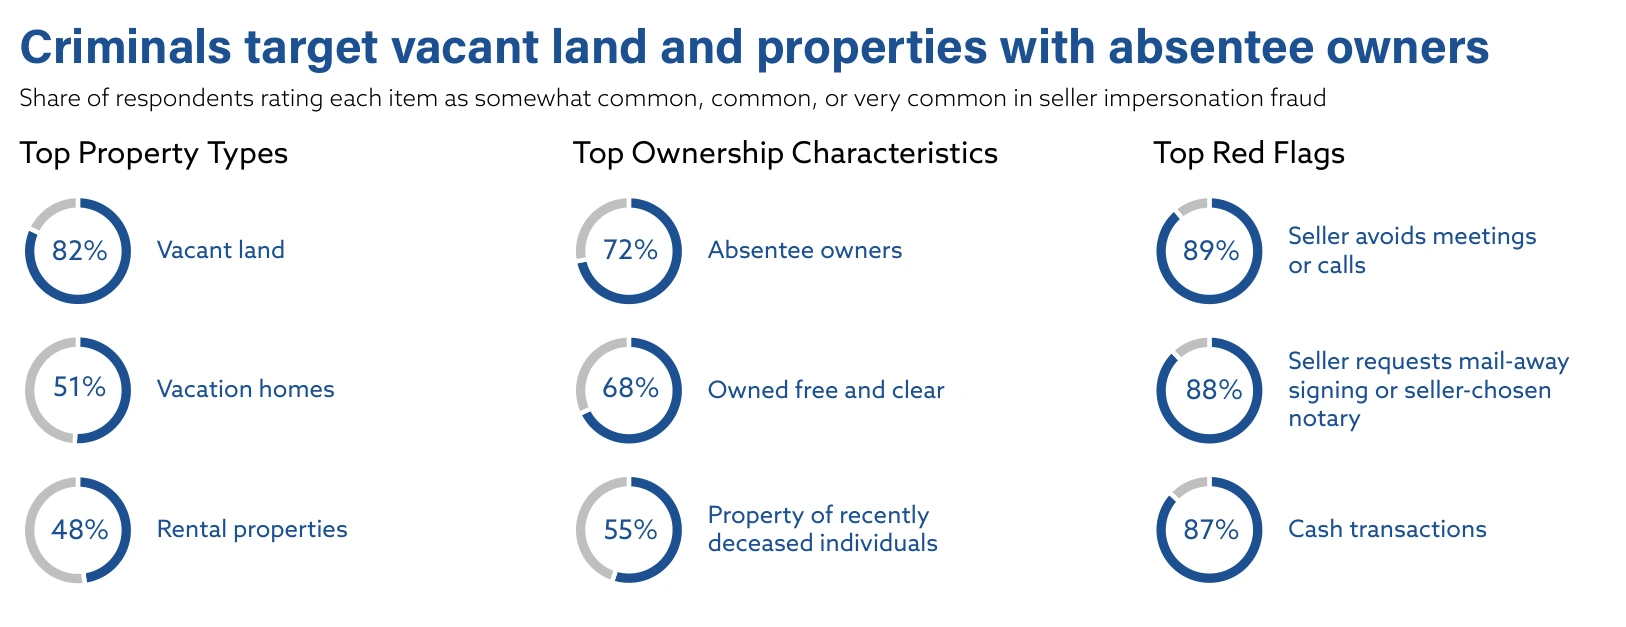
Each share combines somewhat common, common and very common responses. Property and ownership characteristics overlap: a vacant property can also have an absentee owner. These are respondents’ perceptions of cases they encounter, rather than fraud probabilities for all properties in a category. They provide context for associating verification with the actual parties and ownership records.
| Measure | Period / scope | Reported result and source |
|---|---|---|
| Common target: vacant land | 2026 survey; somewhat common / common / very common combined | 82% (ALTA / Elevated Insights Group, September 2026) |
| Common target: vacation homes | 2026 survey; somewhat common / common / very common combined | 51% (ALTA / Elevated Insights Group, September 2026) |
| Common target: rental properties | 2026 survey; somewhat common / common / very common combined | 48% (ALTA / Elevated Insights Group, September 2026) |
| Common ownership characteristic: absentee owner | 2026 survey; somewhat common / common / very common combined | 72% (ALTA / Elevated Insights Group, September 2026) |
| Common ownership characteristic: free and clear | 2026 survey; somewhat common / common / very common combined | 68% (ALTA / Elevated Insights Group, September 2026) |
| Common ownership characteristic: recently deceased owner | 2026 survey; somewhat common / common / very common combined | 55% (ALTA / Elevated Insights Group, September 2026) |
Which red flags and detection practices are reported?
The red-flag shares use the same combined commonness categories. They identify reasons for further verification, rather than proof that a sale is fraudulent. The tools average describes firms’ layered detection practices; the multiple-tool share appears in the takeaways. Identity checks and independently verified contact details serve a different purpose from the convenience of a signing interface.
| Measure | Period / scope | Reported result and source |
|---|---|---|
| Red flag: seller avoids meetings or calls | 2026 survey; red-flag categories overlap | 89% (ALTA / Elevated Insights Group, September 2026) |
| Red flag: mail-away signing / seller-chosen notary | 2026 survey; red-flag categories overlap | 88% (ALTA / Elevated Insights Group, September 2026) |
| Red flag: cash transaction | 2026 survey; red-flag categories overlap | 87% (ALTA / Elevated Insights Group, September 2026) |
| Average helpful detection tools per firm | 2026 survey; red-flag categories overlap | 5.3 (ALTA / Elevated Insights Group, September 2026) |
What do reported real estate fraud losses show nationally and in Colorado?
Complaint reports describe incidents brought to investigators’ attention. Preserve the crime category, geography and reporting unit when using them to discuss transaction risk.
What does the national Real Estate category include in the totals?
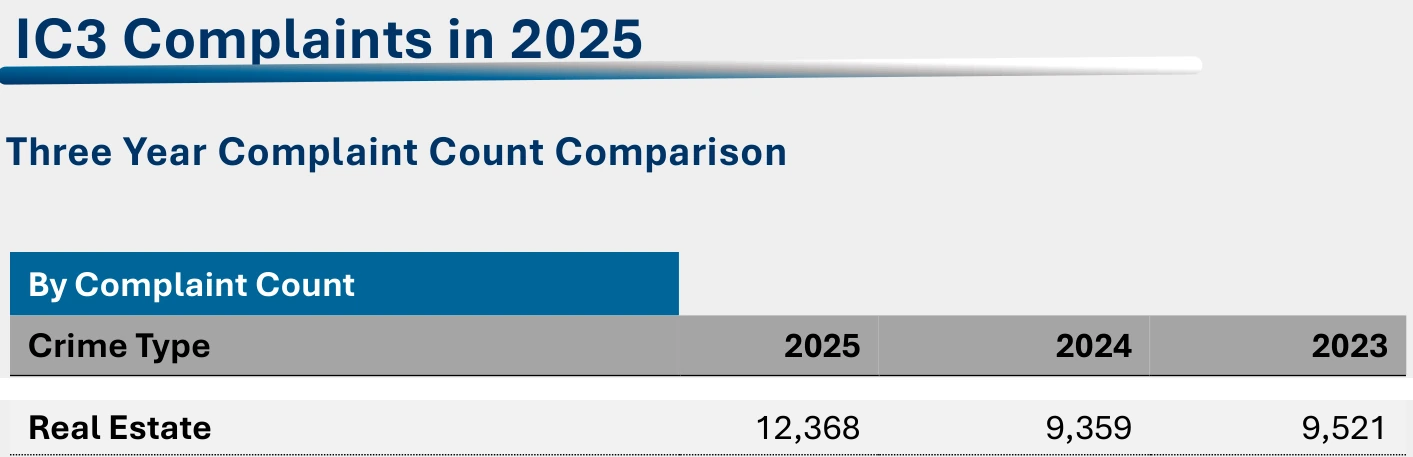
The annual report provides complaint counts and reported losses, including historical comparisons. Its national totals include complaints from outside the United States. Real Estate is a reporting category, with incidents potentially involving other categories too. Preserve the period and label when quoting these figures, and avoid adding overlapping categories into a purported market total.
| Measure | Period / scope | Reported result and source |
|---|---|---|
| Real Estate complaints | 2025, national report | 12,368 (FBI IC3, April 2026) |
| Real Estate complaints | 2024, national report comparison | 9,359 (FBI IC3, April 2026) |
| Real Estate complaints | 2023, national report comparison | 9,521 (FBI IC3, April 2026) |
| Real Estate reported losses | 2025, national report | $275,110,419 (FBI IC3, April 2026) |
What does the Colorado victim-side report show?
Colorado’s report separates victim-side measures from subject-side measures. This subsection uses only the Real Estate victim row: its count is in the takeaways and its losses are below. Victim geography differs from the location of a suspect. The state victim label also differs from the national complaint label, so the two counts should remain separate.
| Measure | Period / scope | Reported result and source |
|---|---|---|
| Colorado Real Estate victim losses | 2025, Colorado | $3,843,805 (FBI IC3, April 2026) |
How does business email compromise differ from real estate fraud?
Business email compromise spans industries. These figures therefore cover more than home closings and remain separate from Real Estate totals. The national report counts complaints; Colorado reports victim-side measures. The operational inference is to preserve reliable communication and payment-verification procedures around a deal. This research does not measure a contract platform’s effectiveness against fraud.
| Measure | Period / scope | Reported result and source |
|---|---|---|
| BEC complaints, all industries | 2025, national report | 24,768 (FBI IC3, April 2026) |
| BEC reported losses, all industries | 2025, national report | $3,046,598,558 (FBI IC3, April 2026) |
| Colorado BEC victim count, all industries | 2025, Colorado | 614 (FBI IC3, April 2026) |
| Colorado BEC victim losses, all industries | 2025, Colorado | $52,544,123 (FBI IC3, April 2026) |
Methodology and Sources
This reference contains 100 distinct, individually cited observations from seven statistical primary documents or datasets. Twelve observations appear in the takeaways and the rest in body tables; figures may illustrate the same evidence. Period comparisons count separately only when their metric, population and period differ. Source checks were completed November 4, 2026. The federal mortgage graph was verified through the public data endpoint used by its JavaScript application; the latest retrieved quarter is 2026 Q2, newer than the indexed page excerpt. Values are rounded to the producer’s two-decimal display precision. Its current-quarterly-filer cohort can change historical results. The source’s quarterly-graph methodology explains this scope.
Survey respondents, reported file workloads, mortgage aggregates, national complaints and state victims remain separate measures. NAR’s monthly comparisons use its table where the accompanying narrative differs. ALTA’s source-use, pain-point and commonness questions allow overlapping responses. The annual-report release month for FBI data is distinguished from the calendar year being reported. Producer concentration groups NAR documents together, ALTA documents together and both FBI documents together. No producer contributes more than forty percent of observations.
The page is written for agents and transaction coordinators evaluating contract workflows. It does not estimate product outcomes or imply that signing technology verifies ownership, approves financing or eliminates fraud. The intended editorial review cadence is monthly, with the original observation periods retained at each review.
Glossary
- ALTA: American Land Title Association.
- BEC: Business email compromise, a reporting category covering multiple industries.
- CFPB / FFIEC: Consumer Financial Protection Bureau / Federal Financial Institutions Examination Council.
- Conforming / non-conforming: Distinct conventional mortgage categories retained as labeled by the federal source.
- CRM: Customer relationship management software.
- Curative work: Work to resolve title defects or outstanding requirements before a file proceeds.
- FHA / VA: Federal Housing Administration / U.S. Department of Veterans Affairs loan categories.
- HMDA: Home Mortgage Disclosure Act.
- HOA: Homeowners association.
- IC3: FBI Internet Crime Complaint Center.
- NAR / REALTOR®: National Association of REALTORS® / a member of that association.
- Quarterly filer: A lender required to file quarterly HMDA data; the graph is not a census of all lenders.
- SIF: Seller impersonation fraud.
Sources
- NAR: September 2026 REALTORS® Confidence Index Survey. October 2026. September 2026, August 2026 and September 2025 comparisons.
- CFPB / FFIEC: HMDA Quarterly Graphs: Denial Rates. July 2026. 2025 Q3 through 2026 Q2; series updated July 30, 2026.
- ALTA / ndp analytics: Measuring the Complexity of Title Production. March 2026. Survey conducted in 2025; publication March 2026.
- NAR: REALTORS® Adopt Technology to Save Time and Improve the Client Experience: 2026 Technology Report release. September 2026. 2026 Technology Report, released September 22, 2026.
- ALTA / Elevated Insights Group: Seller Impersonation Fraud Study: public infographic. September 2026. Spring 2026 survey; prior calendar year means 2025; prior-month responses refer to April 2026.
- FBI IC3: 2025 IC3 Annual Report. April 2026. 2025 and the report’s 2024 / 2023 historical comparison.
- FBI IC3: 2025 Colorado IC3 Annual Report. April 2026. Calendar 2025, victim geography: Colorado.
- CFPB: HMDA Quarterly Graphs methodology. Cohort, reporting and revision notes; checked November 4, 2026.
- NAR: publicly shared Technology Report infographics. Source artwork for Figure 4, September 2026.